Thursday, September 11, 2014

Lab 5 Heat Engine ->Candle phenomenon, Work done by Gases from different temperature gas inside flask and glass jar with candle falling down, Rubber, Heat engine and demonstration<-

Candle phenomenon
 

 All three above are the predictions of the processes and the outcome of the candle experiment.

Active physics Questions Answered.

4 Main types of processes and their PV
diagrams.

Calculations of work done by gas.

More of work done by gas calculations.


Setup for the candle with my lighter
The candle was 

Setup for candle 
The candle was not because
the combustion process
makes air flow into the big tube
and CO2 out of small tube. 
Materials for candle experiment.
Candle went out fast due to
lack of air (O2) flowing into the tube.


Work done by Gases from different temperature gas inside flask and glass jar with candle falling down


From this experiment, we learned that flask. 

Device for isobaric process
Professor Mason is changing the volume slowly for this one to have a isothermal process. 
From this experiment, we learned to use the formula of W=Q=P1V1ln(V2/v1) for only isothermal systems. Furthermore the numerical answer we got -2.58J. it is negative because work is done on the system.

Shorter video of same setup.
Calculation.

Rubber, Heat engine and demonstration
Rubber heating process (cycle) for
understanding First law of Thermodynamic for creating a autonomous process.
Custom Heat engine example made by Tommy.

Demonstration of Tommy's Heat
Engine.

Simple multi-step heat engine calculation for Q, Eint and work.


List of Possible future test variable to calculate for isothermal prcesses.


Monday, September 8, 2014

Lab 4 Kinetic Theories-> Work by Gases from different temperature gas inside flask, First Law of Thermodynamics, Molecular Dynamic Applet presentation, The Fire Syringe<-

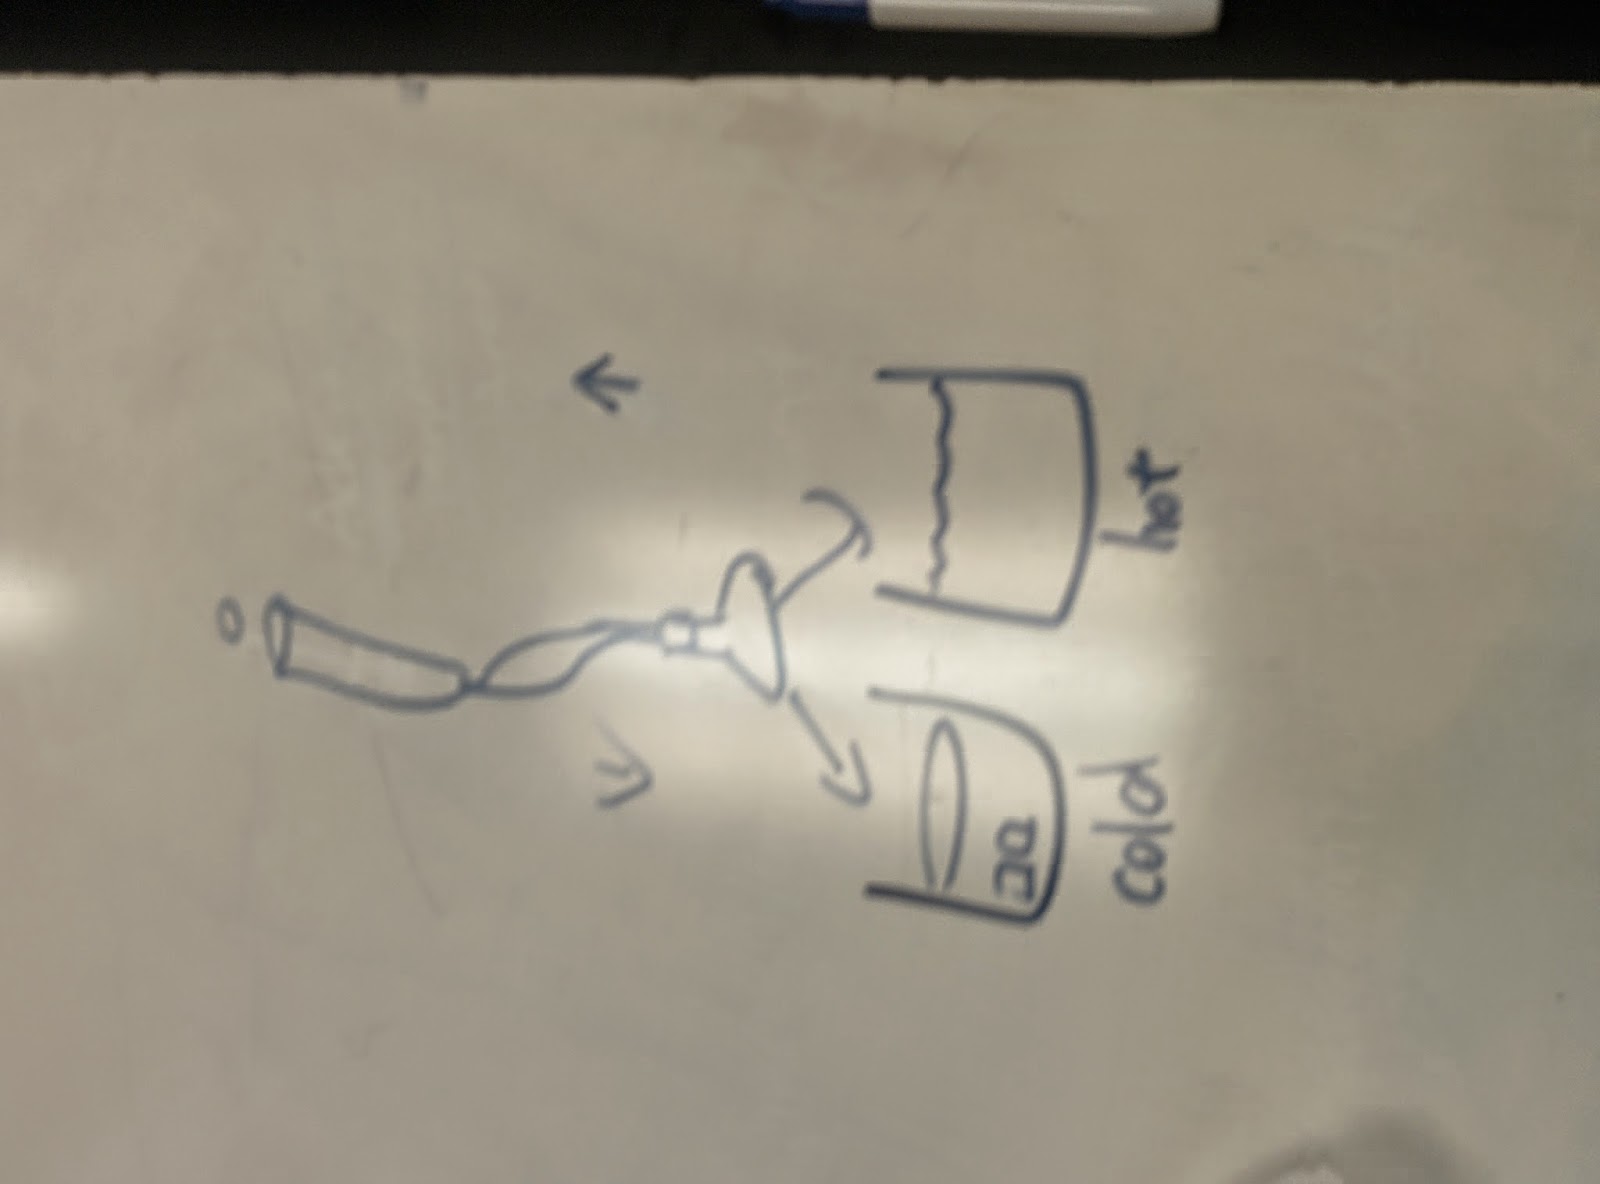
Work by Gases from different temperature gas inside flask


Pictorial demonstration.


The lab setup was to put flask to either hot or cold beakers of water.
Setup
Setup for work done by gas. as Flask full of air with increased temperature push up, or decreased temperature goes back down.

The effect was that the hot beaker makes the syringe go higher, and cold syringe makes it go lower.

Molecular Dynamic Applet presentation
*http://physics.weber.edu/schroeder/software/mdapplet.html
Dynamic Molecular Applet
The model shows how particles move when different conditions are changed. For example, higher temperature will increase the particles movement speed because there is excess heat energy introduced into the system.

Fire Syringe
Note:  The paper flashpoint of 451 degrees Fahrenheit is well known to readers of Ray Bradbury’s famous science fiction novel, Fahrenheit 451, about book burning for the sake of maintaining a stable society.
Fire Syringe lighting fire using by the adiabatic process.

Radius .5 cm and volume calculation .49^2pi*initial or final air column
Final L= 1.97, wrong in the picture.
V1T1^5/2=VfTf^5/2
Tf=(H/Hf*T^5/2)^2/5=612
Compare to true value 451
   percent error:(612 -451)/451= 31.5%

Thursday, September 4, 2014

Lab 3 Ideal Gas laws ->Rapidly Imploding Can, The Manometer Setup, Ideal Gas Law verification(LoggerPro), Balloon and marshmallow demonstration(imperfect)<-

Rapidly Imploding Can
Boiling water in can and dunking it in cold reservoir water
Imploding Can Setup and demo.


Prediction:The can will fast implode because of PV=nrT
In demo, we heated the water inside a soda can and then turned it upside down into a container filled with cold water. We observed the affects the temperature change would have on the can. It was discovered that as the temperature decreases (ice bath) the volume decreases as well (imploding of can). Thus, according to demo, the steam inside the can immediately condenses and act as if a vacuum condensing the can very fast. 
We were asked to find the relationship between force and momentum.
The Manometer Setup
Pressure=F over area
Manometer formulaic explanation.
   Pressure is found by first finding the height difference from the equilibrium point. Then, the point after blowing into the straw is found later. Based on the calculations in the picture,  the pressure is dependent on the height of the water. The density and the value of gravity remains the same and so using Pressure=Force/Area, the formula can be rearranged to find the weight of the column of water. Manometer used most widely in thermometers and various thermo measuring devices. 
Ideal Gas Law verification(loggerPro)
Prediction
For this part of Lab, we predicted syringe as it will have linear relationship from 20 mL of air to 5 mL of air against the pressure as the result. But result surprises us because the non-linear nature of pressure and volume shown in Logger Pro graph.
However, realistically, the result came as a inverse relationship.

We tried to fit it using linear line Pressure=MV+b which surprisingly have a high correlation but doesn't really explain the graph visually. But by convention, we use a inversely proportion comparison between pressure and volume


   Overall, we determined the relationship between pressure and temperature would be linear and proportional. After the experiment, putting a 125 mL flask into boiling water, the prediction was proven correct. Although showing some error, the LoggerPro graph is roughly linear. When giving the physical meaning to the best fit line, it looks similar to P=P0+ρgh equation.
   After studying the relationship between temperature and volume, a 25 mL flask was put in a beaker of cold water, room temperature water, and hot water and the pressures were recorded for each beaker of water. By using LoggerPro from its trendline equation, we have supported a linear relationship between the two.
   Furthermore, the pressure is constant, the volume is able to change because the temperature is changing as well. Thus, volume and temperature are proportional and that when one increases, other increases also from the assumption that the pressure is kept constant.

Concluding Boyles and Charles Law below
   From knowledge gained from previous experiments, the relationship between volume, temperature and pressure were combined to make an equation. However, because temperature is constant, we can replace that with c3 and make the equation of Pressure=constant/Volume. And this supports the previous prediction of pressure and volume being inversely proportional according to Boyles law.
Prediction of Balloon 1 to .1 to 1.1 atm

Balloon and marshmallow demonstration(imperfect) demonstration

Marsh-mellow shrinking
experiment,
due to imperfections, the
marshmallow
 will be blown up due to air
cavities.


Observation of the balloon expanding

Balloon expanding in a pressure meter.

Video of 1 atm to .1 atm.

Video of .1 atm to normal 1 atm.


   Analysis: In expanding balloon experiment, prediction of the balloon will increase in size when the pressure decreases and when the pressure returns to its original state, as well as the balloon. It was proven that the volume increase when pressure was decreased. However, when the pressure returned to the original pressure, the balloon shrunk smaller than its original size. This is due to the loss in n, number of moles. It is highly possible that gas molecules escaped during the experiment of the pressure machine.
   For the second experiment with the marshmallows, a similar predictions were made that a increase in volume with a decrease in pressure and a smaller than its original size when pressure returned to normal because we were thinking of its imperfectsions. After performing the experiment, it was seen that the marshmallow did increase in size when pressure decreased, like the balloon, the marshmallow had a smaller size because there were microscopic holes in the balloon and marshmallow that leaked air and the both of them loses part of their structure after expansion. Once again, this could also be due to the loss in the n.


Tuesday, September 2, 2014

Lab 2 Linear and Volume expansion of materials by thermal conduction ->Brass ring expansion, Differences in Thermal Expansion, Linear Thermal Expansion Demo, Latent Heat<-

Brass ring expansion
Prediction

One of the first experiment we did was the demonstration of teacher increasing temperature of metal ring. In room temperature, the metal ball would not go through the metal ring.

Question involved the hole: When the brass plate is heated up by the gas burner shown in the photograph, the hole will:  
  • (a) get bigger. (predicted and was correct)
  • (b) get smaller.
  • (c) remain the same size. 
The process of heating the metal ring using a blow torch fueled by propane.

The heating process continues and it almost seemed no difference to naked eye but it can now let the metal bball go through the hoop.
Analytical learning points: linear thermal expansion is demonstrated here by the brass hoop enlarging as it gets higher temperature. Also, this indicates that metal or other solid material expands when heated, in particular brass, will expand at such a distance between any two points on the metal plate increases by the same ratio. The distance between two adjacent corners, or two diagonal corners, or diameter across the hole. However, there is one expansion especially excluded is that the brass does not expand into the hole, which is supported by the demonstration.
Differences in Thermal Expansion
Furthermore, professor Mason demonstrated the properties of Thermal Expansion difference of different materials, with the help of bimetallic strip: one side with invar(alloy of nickel and iron) and other side with brass.
Heating up of Bimetallic strip. 3 tests performed by professor Mason.
Picture showing prediction bimetallic strip when it was heated from the invar side and heated from brass side. Our prediction was that it will bend toward invar side on both demonstrations because of invar's lower linear and volumetric coefficient. 

This is the video shows that the curvature is happening toward the invar side when heat is applied


Bend toward Invar side by heating from brass side.
on both the brass side and invar side.

Bimetallic strip heating on Invar
Bimetallic Strip Cooling Demonstration
Analysis:
During the course of this video, we have learned that the bimetallic strip will indeed bend toward the invar side because the invar has a much lower linear and volumetric coefficient. From the three events we see three effects supporting the importance of volumetric coefficient of materials reacting to heat and cold.


In this picture, we calculated the alpha of steel from the given values. and drew a prediction graph.
Below (2) are more pictures showing the setup for melting ice.


The three pictures above are demostrated by Professor Mason to see the expected shape of the graph according to real time experiment.


This picture is the setup for experiment.

Another example of thermal expansion
This picture is for the final value from our measurement. This graph is similar to the graph Professor mason have except with fluctuations in the graph during the initial setup with the uneven stirring force applied.

From doing the experiment above of testing the fusion of water, ice's specific heat, and water's specific heat, we find that we were close but not that accurate, And the values we find are Cw=4.22J/g, Lf=421.6J/g, and Lv=1408J/g


This is the Q
Overall
Expected Lf, Cw, Lv
Accepted kj/(kgK)
Percent discrepancy
421.6
334
27%
4.22
4.186
0.012%
1908
2256
15%
As one can see, for the latent heat of fusion and the specific heat of water calculated, the values were larger than the accepted values. This is due to many factors. Error could have been present in the tools used such as LoggerPro itself and the device used to measure the temperature. 


This was the graph teacher's experiment

Below are uncertainty calculations for Lf, Cw, Lv


Uncertainty:
Ulv=234.34J/g
Ulf=15.35J/g

Ucw=0.2734J/g/K


The water did not boil at 100ºC, instead it boiled at 96.2ºC. There could have been error in the experiment as well. The lab was done in a glass beaker, a material that does not insulate heat as well as styrofoam or another material and so accurate data could have been lost through glass absorbing some of that heat. For the latent heat of vaporization, the calculated value was higher than the actual. This could be due to using the calculated value of the specific heat of water. We used a calculated value to calculate another and this added to the error. Overall, the percent error as not large for Lf and Lv. and this is most likely due to error in reading the graph from LoggerPro. It was difficult to find the right spot on the graph for the times and temperature that the system no longer had anymore ice and so this could be a reason to such a high amount of error of 27% and and 15% compared to a good error amount from specific heat of 0.012%. From knowing the uncertainty and comparing to the percent discrepancy, one can see only the Cw is inside the uncertainty range. 


Interesting Things learned: Don’t make floors out of brass!